Monday 22 August 2016

Invasive Mole

Definition:


Invasive mole are tumorous growth captured under the spectrum of Gestational Trophoblastic Disease and demonstrates an aggressive growth pattern with local invasion, its a non-meatastasising tumor.


Epidemiology:


An invasive mole develops in approximately 10-20% of patients after molar evacuation and infrequently after other gestations. An invasive mole has the ability to penetrate and may even perforate the uterine wall.


Pathogenesis


Invasive moles arise from hydatidiform moles, this tumour is locally destructive and may invade parametrial tissue and blood vessels. There is invasion of the myometrium by hydropic chorionic villi, accompanied by proliferation of trophoblast.


Diagnosis


Laboratory

 
As with other form of gestational trophoblastic disease, maternal serum βHCG values are markedly elevated.

Ultrasound

 
May be seen as an echogenic vascular mass invading the myometrium. Colour Doppler interrogation will show high velocity, low impedence flow.

Pelvic MRI


On MRI, it often appears as a poorly defined mass that deeply invades the myometrium. Complete or partial disruption of the junctional zone may also be seen.
Typical signal characteristics include:
  • T1: isointense to the myometrium with scattered foci of high signal intensity (from the presence of haemorrhage)
  • T2: mixed signal intensity
Molar-like structures appear as tiny cystic lesions within the well-enhanced zone of trophoblastic proliferation in a mass of the invasive mole.
With the penetration of the tumour into the myometrium, the invasive mole can appear as a more aggressive entity compared with a choriocarcinoma.
Invasive mole MRI


Invasive Mole U/S

Wednesday 22 June 2016

For the Love of Better CT Images

New CT detectors promise sharper images

Why has so little happened with CT detector technology in recent years? The short answer is that the next big leap forward is a giant one. But exciting new technologies are definitely making their way to commercial CT scanners, according to an opening-day talk at the International Society for Computed Tomography (ISCT) 2016 Symposium.

New CT detector technologies are being developed because "today's CT detectors use scintillator materials and they are not perfect," said Dr. Norbert Pelc in a talk presented on behalf of the author, Willi Kalender, PhD, from the University of Erlangen. Kalender couldn't attend this year's meeting due to a broken arm.
Future perfect
What kind of CT detector would be ideal? The next generation of detectors is a tall order by any measure, said Pelc, who is a professor of radiology and bioengineering at Stanford University. Kalender is a professor and chairman of the Institute of Medical Physics at the Friedrich-Alexander-University Erlangen-Nuremberg in Germany.
The ideal CT detector for a scanner would offer 100% absorption efficiency, so that "it would detect all of the x-rays incident on it," Pelc said. "In order to do that, it would also need to have 100% geometric efficiency and not lose any photons because they don't hit any nonsensitive parts of the detector. The signal would come out immediately, so it would have no signal lag or afterglow," he said, referring to the energy that continues to emerge from even the fastest scintillator detectors once switched off.

The ideal detector would also have very high temporal resolution and good energy resolution to provide accurate information about each photon. It would be easy to manufacture, low-cost, and extremely stable, Pelc added.
Today's detectors all use scintillators to convert x-rays to light. On the front of today's detector is an array of scintillators, each absorbing x-rays and producing light. The scintillators are isolated from each other with reflector material, so that there is no cross-talk. Typically they are arrayed with 64 detectors in the long direction and 16 channels in the short direction; behind them are the electronics needed to convert the optical signals to electrical signals, amplify them, digitize them, and connect them with the rest of the CT system, Pelc said.
"I've been in the CT field for a long time, and the last commercial detector I helped design had less channels than this module," Pelc said of an example on the screen. "So I think the manufacturers deserve some credit for the extent to which they've been able to integrate and simplify the construction of these detectors so we can have massively multichannel systems."
A typical 64-detector-row scanner consists of 180 channels in the long direction and 64 in the slice direction, all covered by an antiscatter grid. The reflective material is a key weakness of current scintillator-based detectors, reducing geometric efficiency because the x-rays that strike the reflector material don't produce any signal. Even if the reflective material could be removed, geometric efficiency would still be lost on the antiscatter grid, he said.
But detector scintillators are much faster than they used to be, a requirement for today's faster gantry rotation times, Pelc said. New scintillators use ultrafast ceramics or gemstone materials to speed signal transmission. They are "cableless," meaning they are integrated into the electronics without wiring. As a result, electronic noise has been reduced substantially, making the systems more dose-efficient as well.
Direct-conversion detectors
"We are also now starting to see experimental scanners that use direct conversion detector materials" for research use only, Pelc said. The most commonly used materials for these are cadmium telluride (CdTe), cadmium zinc telluride (CdZnTe), and even mercuric iodide (HgI2), although Pelc said he can't think of any large detectors made out of HgI2 just yet.
"These direct conversion materials have been around for decades and used in high-energy physics," he said. They've long sparked interest in the CT community inasmuch as they offer the possibility of photon counting and energy discrimination, which would be "a significant improvement to our CT scanners if we could get them to work reliably and at a reasonable cost."
Direct conversion detectors don't need pixilation, they don't need reflectors, and they don't have dead spaces because of them -- offering the possibility of higher geometric efficiency, Pelc added.
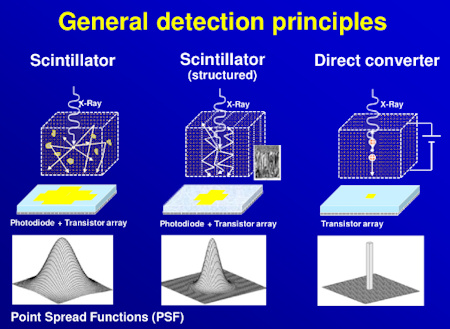
When x-rays come in contact with a scintillator, the light diffuses and spreads, he said. Reflectors are used to isolate the light. But a direct conversion material doesn't generate light, just electrons and poles. The direct conversion detector sends the electrons on a narrow path through the semiconductors in the direction of the charge carriers. The energy doesn't disperse as much as with scintillators, creating a much sharper point-spread function and hence a sharper image.
Thus, while scintillators suffer from light spread, direct detectors have very little charge spread, Pelc said. "For example, for a 1-mm cadmium telluride detector, as the charge diffuses through that 1 mm, the spread of the charge is only 10 to 30 microns, whereas the light from a scintillator would spread much farther," he said.


Higher temporal resolution
The temporal resolution of some detector materials such as CdTe is also quite high, typically well under 100 nanoseconds. "Since the signal comes out so fast, it makes it possible to count individual photons, and, in fact, you can even use them in nuclear medicine for coincidence imaging like for PET," he said.
Today's scintillators are faster than they used to be, but the ones in CT scanners aren't fast enough for photon counting. Scintillators used in CT today exhibit decay times of typically 1 nanosecond or more and an afterglow of at least 50 nanoseconds; both of these qualities prohibit their use in photon counting. That said, some scintillators are fast enough for photon counting, and they're used commonly, Pelc added.

Drawbacks remain
Still, there are potholes in the path forward for cadmium telluride, Pelc said.
"They're available only in small tiles, and you have to have some way to build a large detector out of them; currently we don't have four-way buttable solutions, meaning it's hard to make the detector large in both directions," he said.
Dr. Norbert Pelc from Stanford University.
Also, CdTe remains much more expensive than other detector types. Photon counting efficiency decreases at high count rates and it's hard to make them count faster, he said. Presently, about 200 million counts per second per square millimeter (2 x 10⁸) is the counting speed limit -- and that's still too low for high-power clinical CT, Pelc said. Finally, CdTe detectors have an imperfect energy response.
"To conclude, there have been advances in traditional photodiode detectors, there is potential for improvement through the use of direct-conversion CT detectors, and we look forward to them in the future being used in clinical CT scanners," Pelc said. Their eventual acceptance in the marketplace "will depend on their performance compared to conventional systems," he added during a later discussion session.


Detector efficiency and point-spread function improve significantly from scintillator technology (left), to structured scintillator design (middle), to direct converter technology (right). Image courtesy of Willi Kalender, PhD.

High iodine concentrations don't improve CCTA

Using higher iodine concentrations when performing coronary CT angiography (CCTA) yields no significant improvement in contrast attenuation, concludes a new study led by cardiac imaging pioneer Dr. Stephen Achenbach. There was higher attenuation with higher iodine concentrations, but no change in signal-to-noise or contrast-to-noise ratios.
Researchers from the University of Erlangen in Germany and 22 other European centers aimed to show that high-iodine concentration contrast media are not superior to standard-concentration formulas, and they did so. The study randomized 452 patients from five countries to receive iobitridol 350 or one of two standard-concentration formulas. The average signal-to-noise ratio (SNR) and contrast-to-noise ratio (CNR) did not differ among the patient groups.
"The main finding is that minor differences in contrast agent concentration may not be all that important for image quality in coronary CTA," Achenbach toldAuntMinnieEurope.com. "No difference was found in regards to image quality, and importantly, diagnostic confidence," when comparing the three contrast agents.
The study is the largest to date to address the relationship between iodine concentration and image quality, the authors noted (European Radiology, 23 May 2016).
Contrast protocols are of key importance in CCTA, which is used to identify coronary artery stenosis as well as detecting and characterizing calcified and noncalcified plaque. Studies suggest lumen opacification of at least 300 HU is required to identify all components adequately, using a carefully administered contrast protocol that measures iodine delivery rate and provides enough iodine to do the job, but not too much.
Optimizing contrast
Several groups have looked at different CT attenuation levels with different contrast media protocols, but few have assessed the impact of iodine concentration on image quality, or determined whether differences of less than 50 mg/mL of iodine concentration could affect image quality.
Higher iodine concentrations produce greater opacification, but whether this benefits interpretation is unclear, especially considering that higher iodine concentrations raise potential risks for patients. So the optimal attenuation for CCTA is still being debated, the authors wrote.
Increasing total injected iodine "could raise safety issues for patients at risk such as contrast-induced nephropathy," they stated. "Therefore, adequate contrast enhancement must be balanced against the amount of iodine injected."
Three agents head to head
This study compared a contrast media formula with iodine concentration of 350 mg/iodine mL iobitridol (Xenetix, Guerbet) with two other contrast media formulations with higher iodine concentrations, including iopromide 370 mg/ml (Ultravist, Bayer Healthcare) and iomeprol 400 mg/ml (Iomeron, Bracco Diagnostics). The main objective was to demonstrate statistical noninferiority of the lower-concentration formula to the two alternatives.
The study examined 452 symptomatic adult patients (mean age 57.8) with suspected coronary artery disease who were scheduled for CCTA, in sinus rhythm, and without contraindications to beta-blocker medications, renal insufficiency, or previous coronary artery bypass grafts, stents, or artificial heart valves.
Patients received beta-blockers if their heart rate was above 65 bpm, and a minimum dose of 0.8 mg sublingual nitroglycerine spray before contrast medium injection and the scan. Contrast volume and delivery rate varied according to patient body weight from 4 ml/S for 60 kg and under; to 75 mL/S at 5 mL/S for 60 kg to 80 kg; and 90 mL at 6 mL/S for body weight greater than 80 kg. Injections were followed by a 100% saline flush.
Regions of interest of 2 mm2 were acquired in the left anterior descending (LAD) artery, the left circumflex (LCX) artery, and the left main coronary (LM) artery, as well as larger ROIs in the ascending aorta and left ventricle.
The two core lab readers reported stenosis on a five-point scale ranging from 5 (certainly yes) to 0 (certainly no) and the radiologists recommended patient management options including no action, medication, invasive coronary angiography, and other, the team wrote. Commercially available software (Comprehensive Cardiac Analysis, Philips Healthcare) was used to automatically track each coronary artery up to the distal segments.
Little difference
  • The rate of fully evaluable scans was similar for all three agents, including 92.1% for iobritidol, 95.4% for iopromide, and 94.6% for iomeprol, the authors wrote.
  • Iobitridol demonstrated its noninferiority over the best comparator agent with a 95% confidence index of the difference of [-8.8 to 2.1], with a prespecified noninferiority margin of -10%, the group wrote.
  • Also, no difference was seen regarding the number of stenosis identified with the three contrast media agents. (p = 0.580).
  • Multivariate analyses did show a relationship between calcium scoring and stenosis assessment according to territory (p < 0.001) and between calcium scoring and image quality regardless of territory (p = 0.007), the study team wrote.
  • Average attenuation increased with higher iodine concentrations, but the average SNR and CNR did not differ between the three patient groups, Achenbach and colleagues wrote.
  • The percentage of patients experiencing post CM-injection adverse events ranged from 15.1% for iobitridol, 19.5% for iopromide, and 15.1% for iomeprol. Most were cardiac disorders reported in EKG follow-up, the team wrote.
"This study demonstrated the noninferiority of iobitridol 350 in providing evaluable CT scans for assessment of coronary stenosis, as compared to CM with higher iodine concentrations" (iopromide 370 mg iodine/ml and iomeprol 400 mg iodine/ml).                                              
The results also indicate iodine content can be reduced further, Achenbach et al wrote. As per common practice, iodine delivery rate was not adjusted, although doing so would have eliminated a key limitation.
Dr. Stephen Achenbach, University of Erlangen in Germany. Image courtesy of the European Society of Cardiology.
"The fact that no difference was observed between CMs when considering SNR and CNR cannot be fully explained," the authors wrote. Image noise was relatively low compared with previous studies due to improved technology, limiting the influence of noise on the results. And statistically, variations in image noise across patients and systems may have been larger than variations in contrast enhancement, meaning the difference between the three patient groups may be a statistical effect, they wrote.
The lack of a gold standard test such as invasive angiography means that diagnostic accuracy could not be compared among the three groups, but the limitation appears minor, according to Achenbach.
"While it would have been nice to have accuracy data, which means a comparison regarding the ability to detect stenoses, all parameters analyzed in this trial showed that the image quality and diagnostic confidence of the lower concentration contrast was not inferior," he wrote in an email. "It is hence rather safe to assume that diagnostic accuracy will also be equal."
The relatively low calcium burden in the population was another limitation. And injection rates were constant and not adjusted to achieve equal iodine delivery rates across the three groups.
"It was an additionally very comforting finding to see that in all patient groups within this study, the rate of 'fully evaluable' coronary CTA examinations was between 92% and 95%," Achenbach concluded. "Coronary CTA has become a very stable and robust imaging modality."
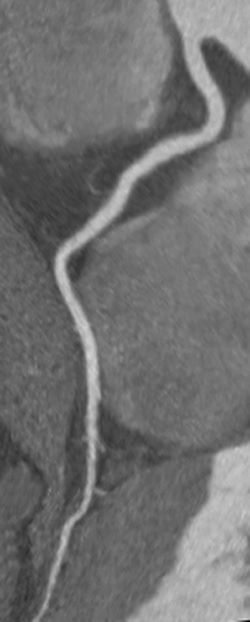
CCTA of a right coronary artery without stenosis or artifacts, imaged with iobitridol 350 mg iodine/mL. Image courtesy of Dr. Stephen Achenbach.


10 years of Dual Source CT (still the unrivalled gold standard)


More than 10 years ago, CT engineering had reached a plateau. Experts and engineers at Siemens CT quickly realized that simply adding more slices wouldn’t help clinicians achieve the kind of temporal resolution needed to overcome a range of imaging challenges.

In Cardiac CT, for example, high and irregular heartrates lead to undiagnostic images. You simply couldn’t scan fast enough. Siemens CT took on the challenge and concentrated on answering a simple question: Are we able to provide optimum image quality for any patient, regardless of age, size, weight, and physical condition?

The answer wasn’t easy to find, and even harder to engineer – but in 2005 , the answer was "Yes!": the birth of Dual Source CT.
In 10 years, in over 1,500 installations around the world, and in thousands of clinical cases, Dual Source scanning has proven a great advantage for clinical routines across all fields of medical imaging.

What started as an ambitious challenge became the industry’s unrivalled gold standard.

Malpractice in Radiology a serious concern


In radiology, there are two main areas that make the radiologist vulnerable for medical malpractice: failure to diagnose and failure to communicate, Michael Raskin, MD, MPH, JD, said at RSNA 2015.
Failure to diagnose is the number one reason radiologists get sued, he said. Within failure to diagnose is failure to perceive, which means the abnormality on the film was missed, and failure to correctly interpret, which is more of a cognitive error, he said.
“You don’t know what you don’t know,” Raskin said. “So you have to be keeping up with the literature of what’s going on in radiology because if you’ve never seen, for instance, pneumocystis carinii pneumonia, you’ll never make the diagnosis of it because you don’t know what it looks like.”
In failure to communicate, it’s less of the urgent, life-threatening findings that cause law suits, but more of the unexpected findings. For example, Raskin said, a lung tumor seen on a shoulder X-ray, or a kidney tumor seen on an MRI of the lumbar spine.
“The radiologist sometimes drops the ball on communicating the unexpected finding to the referring physician,” Raskin said. “Sometimes it requires a direct communication, or what we call nonroutine [communication].”
To safeguard against malpractice, Raskin recommends closed loop communication, similar to what the airline industry uses. The airline industry will instruct, “Land on runway 27R, confirm” and the pilot repeats back, “Land on runway 27R.”
“You not only tell them the information,” he said. “You make sure that they understand what you’ve said.”
As a further confirmation, Raskin recommended documenting the conversation, including when it happened and what was discussed.
Courts are also increasingly expecting radiologists to follow-up with referring physicians after several weeks have passed to confirm if they’ve followed up with patients discussed in previous conversations

Friday 10 June 2016

Hydatidiform Mole

Definition:

Hydatidiform Mole is one of the most common form of Gestational Trophoblastic Disease, but a benign one.

Epidemiology:

It is one of the most common complications experienced during pregnancy and occurs in every 1,000-2,000 of pregnancies. It can occur in any pregnant woman of any age, but high incidence has been recorded among pregnant teens, and pregnant woman between the ages of 40-50 years. It is more common in Asian countries.

Pathogenesis: 

Rarely, moles co-exist with a normal pregnancy (co-existant molar pregnancy), in which a normal fetus and placenta are seen separate from the molar gestation.
 A hydatidiform mole can either be complete or partial. The absence or presence of a fetus or embryo is used to distinguish complete moles from partial moles. Complete moles are associated with the absence of a fetus and partial moles usually occur with an abnormal fetus or may even be associated with fetal demise.
Ninety percent of complete hydatidiform moles have a 46XX diploid chromosomal pattern. All the chromosomes are derived from a single sperm in 90% or less likely two sperms, suggesting fertilization of a single egg that has lost its chromosomes.
With partial moles, the karyotype is usually triploid (69XXY): the result of fertilization of a normal egg by two sperm, one bearing a 23X chromosomal pattern and the other a 23Y chromosomal pattern.
 Location:
Complete hydatidiform moles usually occupy the uterine cavity and are rarely located in fallopian tubes or ovaries.
The chorionic villi are converted into a mass of clear vesicles that resemble a cluster of grapes.
Laboratory Markers:
In the classic case of molar pregnancy, quantitative analysis of beta-HCG shows hormone levels in both blood and urine greatly exceeding those produced in a normal pregnancy at the same stage.

Diagnosis:

Ultrasound
Complete Mole
>Enlarged Uterus
>Solid collection of echoes alternating with numerous 3-10mm anechoic spaces known as SNOWSTORM APPEARANCE or BUNCH of GRAPES
Normal Interface between myometrium and abnormal trophoblastic tissue
> No Identifiable fetal tissue or gestational sac seen
> May show high velocity, low impedance flow on color doppler.

 >The molar tissue demonstrates the bunch of grapes sign which represents hydropic swelling of trophoblastic villi.
> Ovarian theca lutein cyst may be seen bilaterally in 25-60% of cases
Partial Mole
>Placenta is enlarged and contains areas of multiple, diffuse anechoic lesions
>A fetus with severe structural abnormalities or growth restriction, oligohydramnios or a deformed gestational sac may be noted.
>Colour Doppler interrogation may show high velocity, low impedance flow.
> Ovarian theca lutein cyst may be seen bilaterally in 25-60% of cases
 MRI
MRI shows heterogenous endometrial thickening with T2 hyperintense areas. MRI is indicated in aggressive gestational trophoblastic disease to look for myometrial invasion and pathologically dilated endometrial, myometrial, or parametrial vessels.
CT
A CT scan usually demonstrates a normal-sized uterus with areas of low attenuation, an enlarged inhomogeneous uterus with a central area of low attenuation, or hypo-attenuating foci surrounded by highly enhanced areas in the myometrium.

Complications:
A complete mole can progress to invasive mole (~15%) or to gestational choriocarcinoma (~7%).

Complete Mole
 
Partial Mole


Saturday 7 May 2016

Siemens Healthcare now known as Siemens Healthineers

May 4, 2016 -- German industrial conglomerate Siemens AG has changed the name of its Siemens Healthcare business to Siemens Healthineers.


Siemens said the new brand name "underlines Siemens Healthcare's pioneering spirit and its engineering expertise in the healthcare industry."
Siemens Healthineers will continue to be managed as a separate entity within the parent company as part of the overall Vision 2020 strategy, in which the healthcare division would be managed as a "company within a company" with a new organizational setup.


Siemens Healthineers logo

Radiation Hazards

Spanish group warns of radiation emitted by patients
May 3, 2016 -- Patients injected with radiopharmaceuticals for nuclear medicine procedures continue to give off radiation after their scans are completed, and steps should be taken to reduce the public's exposure to these individuals until the radiopharmaceuticals decay, according to Spanish researchers.
The findings, published in the current issue of the Revista Española de Medicina Nuclear e Imagen Molecular, found that individuals who accompany a patient who has been injected with a radiopharmaceutical may be exposed to as much as 0.63 mSv of radiation.
The paper, by Dr. Verónica Morán Velasco from the Clínica Universidad de Navarra and colleagues from the Instituto de Investigación Sanitaria de Navarra, both in Pamplona, also suggests that physicians who regularly tend to nuclear medicine outpatients consider restricting the number of scans they oversee during the course of a year to also avoid unnecessary radiation exposure as well.
The recommendations are dependent, in large part, to the amount of dose administered, as long as the reduction in radiotracer does not adversely affect the quality of the diagnostic study (Rev Esp Med Nucl Imagen Mol., May-June 2016, Vol. 35:3, pp. 175-185).
Potential exposure
Several previous studies have explored the degree to which the public may be exposed to radiation from patients who have received a radiopharmaceutical as part of a nuclear medicine scan. However, there is limited information on how much radiation a person in a waiting room may be exposed to right after a patient's injection, or the potential cumulative effect that radiation may have on a physician who sees a patient right after his or her scan.
To try to calculate that effect, researchers prospectively studied 190 patients (124 women and 66 men) with a median age of 58 (range 11 to 93), median body mass of 69.5 kg (range 34 to 125 kg), and a median height of 164 cm (range 147 to 188 cm).
Subjects in the cohort were scheduled for a variety of scans, with the majority of patients (145 cases, 76%) undergoing bone scintigraphy with technetium-99m (Tc-99m).
The study estimated the radiation dose for each subject from the time the radiotracer was injected to the start of the imaging scan, as well as the total time spent in the nuclear medicine department. The latter included the length of the scan, time in the waiting room, and when the patient left the building.
Time, place scenarios
To gauge radiation exposure to people who may come in contact with a tracer-injected patient, researchers created several scenarios. The primary example is an individual such as a family member who accompanies the patient to the facility.
Researchers also crafted a situation where the patient spent 20 minutes in a physician's office at a distance of 1 m during the first five minutes, 0.5 m in the next 10 minutes, and 0.1 m during the final five minutes.
To compare the risk of radiation exposure inside and outside of the nuclear medicine department, the paper created two public scenarios. One case had the patient in a coffee shop for 30 minutes at a distance of 0.5 m to the nearest person and in a restaurant for 60 minutes at a distance of 0.5 m from his or her nearest neighbor.
If the patient were to use public transportation or leave the hospital in a private vehicle, it was assumed he or she would spend one hour riding at a distance of 1 m from the nearest passenger.
Exposure calculations
Using the above-mentioned time and distance parameters and applying laws related to the decay of radioactive contrast agents, researchers estimated that a person who accompanies a patient might receive up to 0.63 mSv for cardiac studies or 0.18 mSv for bone scintigraphy exams.
Meanwhile, the dose received by coworkers in the scenario of a patient who returned to work immediately after a scan was 82 µSv -- an amount that would be dramatically reduced if the patient did not return to work until the day after the exam. A physician may receive 23 µSv while in close proximity to the tracer-injected patient, compared with 43 µSv for a person at a restaurant, and 22 µSv for a nearby person in a coffee shop.
"After finishing the procedure, these doses are reduced by a factor of three," the authors wrote. "In most of the studies, the use of private instead of public transport may reduce the dose by more than a factor of six."
Of particular note is the finding that a person accompanying the patient to the scan may be subject to radiation similar to the dose received by the patient. Therefore, researchers recommended a greater distance between radiotracer-injected patients and others in the waiting room, based on the type of scan performed and amount of radiopharmaceutical injected.
In addition, they wrote it "may be necessary to limit the number of patients undergoing nuclear medicine diagnostic tests attended by physicians in their consulting offices."
And, once the scan is completed and the patient is set to leave the building, the paper recommends he or she use private rather than public transportation.
"These recommendations are dependent on the dose administered and thus a reduction in dose that does not affect the quality of the diagnostic study would allow a reduction in the dose to which individuals are exposed," the researchers concluded. "A reduction in the radiation dose would not only reduce the individual, but also the collective dose produced by the irradiation of members of the public by patients" undergoing nuclear medicine scans.


Gestational Trophoblastic Disease


Definition:
 Gestational Trophoblastic Disease (GTD) results from abnormal proliferation of trophoblastic tissue, and encompasses a wide spectrum of diseases, including:
> Hydatidiform Mole
   -Complete Mole
   -Partial Mole
>Invasive Mole
>Choriocarcinoma
>Placental Site Trophoblastic Tumour (PSTT)
>Epitheliod Trophoblastic Tumour (ETT)

Epidemiology:
GTD is more common in women older than 40 years and younger than 20.

Pathogenesis:
A common characteristic of all GTD is an abnormal proliferation of trophoblast, but different components predominate in different tumours.

Diagnosis:
Clinical diagnosis presents in many ways and includes the following;
>Uterus larger than dates
>Abnormally high beta HCG
>Hyperemesis
>Hyperemesis
>Hypertension
>Theca Lutein Cysts
Although ultrasound (US) is the examination of choice for initial diagnosis, plain radiography, angiography, computed tomography (CT), and magnetic resonance (MR) imaging all play a role in determining the presence of GTD and the extent of its complications. US shows molar gestations as alternating cystic and solid tissue that fills the entire uterus. CT and MR imaging are useful in detecting myometrial invasion, parametrial extension, and metastasis. Because each imaging technique offers a unique perspective highlighting different aspects of GTD, it is important to understand the pathophysiology and natural history of the disease. Such knowledge in turn leads to a greater understanding of the spectrum of findings seen on various kinds of radiologic images and enables the radiologist to play an important role in directing patient work-up by recognizing the implications of various findings and guiding management decisions.


Wednesday 6 April 2016

Cone-beam CT works well in adaptive proton therapy

one-beam CT (CBCT) can help identify treatment-relevant anatomical changes in patients receiving proton therapy for lung cancer, according to new research from Belgium, the U.K., and the U.S.
An adaptive lung-cancer proton therapy workflow that makes use of on-board CBCT has been developed. In the identification of treatment-relevant anatomical changes in patients between radiation doses, CBCT gave similar clinical indicators to regular CT scans.
Compared with conventional photon-based radiotherapy, proton therapy allows for greater levels of dose localization, with virtually no exit dose that would result in tissue damage. The procedure comes, however, with certain drawbacks. Patient motion, particularly with pencil-beam scanning, presents one such challenge. Another difficulty lies in proton therapy's higher sensitivity to anatomical changes -- for example, in the lung -- that can affect the distribution of the radiation dose.

Top row (left to right): The planning CT and CBCT. Bottom row: The dose distribution on the planning CT, and on the virtual CT generated from the CBCT. Images courtesy of Boon-Keng Teo, PhD.


Tumor enlargement or lung collapse, for example, can result in a shortened beam penetration, reducing coverage of the target. In contrast, tumor shrinkage can result in the radiation beam penetrating further than intended, damaging regular tissues. To compensate for this, regular CT scans are taken during the course of treatment to identify anatomical changes and adjust the therapy accordingly.
One alternative to these routine CT scans lies in the use of CBCT, which uses divergent x-rays to create a 3D image. CBCT comes with a number of advantages, offering highly accurate patient positioning, as well as the capacity to monitor the patient in the treatment position and to rapidly assess the current treatment dose.
In their new study, Boon-Keng Teo, PhD, a radiation oncologist at the University of Pennsylvania, and colleagues, has developed a CBCT-based workflow for adaptive proton therapy. First, prior to each individual proton treatment, patients are given a CBCT scan. From this, a virtual CT scan is generated by deforming the treatment's original planning CT scan onto the geometry of the current CBCT scan.
An additional correction step accounts for specific anatomical changes -- such as large tumor regressions -- that cannot be handled by the deformable image registration alone (International Journal of Radiation, Oncology, Biology, and Physics, 3 February 2016).
From this, a fast, range-corrected dose distribution of the intended treatment is calculated. If the identified dosimetric changes are found to be within safe limits, treatment may proceed -- else, an offline review of the virtual CT is called for, which may lead to a replan CT to adjust the treatment accordingly.
To test the concept, the researchers compared their CBCT-derived virtual CTs with corresponding, conventional CT scans of 20 lung cancer patients who exhibited a variety of treatment responses including lung collapse or reinflation, and tumor growth, shrinkage, or density variations.
"A virtual CT generated from a CBCT can give similar dosimetric indicators as a regular CT," Teo said. "In most cases, CBCTs can replace evaluation CTs in proton therapy for assessment of anatomical change, and therefore reduce the frequency of the evaluation CT scans during the course of treatment."
"[This is] the first step toward the clinical utilization of CBCT for adaptive proton therapy, which is essential to fully exploit the physical advantages of proton therapy," said Brian Winey, a medical physicist at Harvard Medical School who was not involved in this study. CBCT, he adds, will allow proton therapy centers to reduce the effects of the range uncertainties that result from anatomical variations during patient treatment.
"Adaptive [proton therapy] workflows based on CBCT and deformable image registration may prove valuable to identify critical cases which may require correction strategies," said Katia Parodi and Guillaume Landry, medical physicists at Ludwig-Maximilians-Universität München who were not involved in this study. They add: "[M]ore research needs to be done to carefully validate deformable image registration accuracy and improve CBCT image quality depending on anatomical location, as well as to identify reliable clinical indicators for proper alerts triggering additional actions during the fractionated treatment course."
With their initial study complete, the researchers are now working to further develop and test their workflow, along with looking to apply the same principle to other possible treatment sites.

How to make the most of dose-monitoring software


Sure, radiation dose-monitoring software can easily provide vital benefits such as dose alerts when imaging studies generate high radiation doses for patients. But the software can also be invaluable for facilitating important workflow changes, Belgian researchers recently reported.
Based on data calculated by their radiation dose management software, a team from Antwerp University Hospital was able to implement a number of changes, including changing alert settings and CT protocols for patient weight-sensitive procedures and implementing alerts for nonstandardized mammography studies.
"For the goal of improving quality and efficiency, we strongly believe that there is big potential in the data that is contained in dose-management software," said Timo De Bondt, PhD, a self-employed medical physicist associated with the radiology department at Antwerp University Hospital.
De Bondt presented the research during a scientific session at the recent ECR 2016 in Vienna.
Standard monitoring
Standard use of dose-tracking software usually involves generating alerts (typically when radiation dose reaches two times median dose levels), implementing a high-dose justification policy for technologists, and reporting of dose data to administrators. The researchers believe, however, that dose-tracking software offers a lot more potential beyond these basic capabilities.
"What we're trying to do now is have some more creative use of the functionalities of this software tool to understand and improve the workflow and evolve from dose-management software toward an internal audit/management tool," De Bondt said.
Using the DoseWatch dose-tracking software (GE), the group reviewed radiation dose data from imaging studies performed at Antwerp University Hospital from July 2015 to December 2015, encompassing two CT, two mammography, two interventional radiology (IR), and six computed radiography (CR) systems. For each modality, multidisciplinary dose teams configured specific alert settings for the software and also developed a standardized procedure for justifying higher dose that includes a predefined list of comments.
"It must be noted that the alerts we trigger now are not necessarily related to the excessive use of radiation," De Bondt said.
CT dose alerts
The institution performed 8,089 CT studies in the six-month period, with 977 exams (12%) triggering alerts from the dose-tracking software. Of the 977 alerts, 766 (78%) were justified, De Bondt said.
Justification for CT dose alerts included the following:
  • Patient weight: 39%
  • Extra image series: 19%
  • Longer scan: 18%
  • Cardiology: 17%
  • Other: 3%
  • Wrong protocol: 2%
  • Arms next to body: 1%
Based on these findings, the department changed alert settings and protocols for patient weight-sensitive procedures, De Bondt said.
The need for an extra image series generated some food for thought, he added.
"To what extent is the exact procedure known in advance?" he said. "Is this extra series based on a clinical question, or is it just a miscommunication between the technician and the radiologist, or the radiologist and the referring physician? We intend to find out."
Cardiology imaging studies at their institution are performed by cardiology department staff, who are not as well-trained in dose risks, he said.
"The obvious action we need to take here is to go knock on the door of the cardiology department and actually train them, because there is an excessive amount of radiation used there," De Bondt said.
Mammography/IR
There were very few dose alerts for mammography studies; only 14/1,666 (0.8%) triggered a dose alert, which were based on the European directives for dose based on breast thickness. Interested in how many mammography procedures at the institution were performed with the standardized number of views, the group found that 80% of procedures have a standard number of radiation events, De Bondt said.
As a result, the team changed the alert settings to provide alerts when there's not a standardized number of mammography "takes," he said.
"So we actually get standardization alerts," he said. "We intend to find out why we have only 80% standardization, because we obviously want to go to 100%."
The team also found "excellent" compliance in the interventional radiology (IR) rooms, De Bondt said.
Share of dose alerts from interventional radiology procedures:
  • July 2015: 27% (96% of which were justified)
  • August 2015: 18% (100% of which were justified)
  • September 2015: 9% (100% of which were justified)
  • October 2015: 23% (90% of which were justified)
  • November 2015: 15% (100% of which were justified)
  • December 2015: 23 (100% of which were justified)
De Bondt noted, however, that almost all of these alerts were justified due to "difficulty of procedure," which is too vague a reason.
"We can't learn anything from that, so we are changing the list of comments here [for justification]," he said.
CR
In CR, approximately 30% of exams -- representing several hundred studies -- were generating alerts. Because that's a lot of exams for which to require justification, the researchers are initially implementing the justification process on a subset of procedures. That data is just now starting to come in, he said.
"We've had a discussion with the dose team and we think that a lot of the alerts are probably [from] fluoroscopy due to lack of blind positioning in the practice," De Bondt said. "But why is it? Is it a lack of education? Is it patient movement? Is it maybe the pressure due to high patient throughput, like the patient waiting room is too full and you really need to go fast? It would be interesting to find out."
Dose-management software such as DoseWatch has a lot of potential and a lot of data from which institutions can extract really valuable data on their workflow, De Bondt concluded.
Institutions can make use of the data gathered by the dose-tracking software to configure the amount and nature of alerts, as well as implement a standardized justification policy for alerts, De Bondt said.
"Based on the analysis, you can understand and adjust the workflow of your department," he said. "Feedback from the workflow is vital in every aspect, everywhere."